
Every four years, the United States choose their new president. It is a political event, of course, but also one of the most observed moments from financial markets around the world. The question that many ask themselves is simple: how much does those who sit in the White House really matters for the trend of the bag?
In this article we will try to respond with the numbers, analyzing the trend of the Dow Jones Industrial Average, one of the most representative share indices of the American economy, during the presidential mandates from 1945 to today.
The goal is not only to understand if there is a cyclicality linked to changes of presidency, the elections, or to the political context, but also to establish which party has done best and which has done worse in terms of market performance.
Do you want help to improve your trading approach? Click here >>>
The economic policies of the two parties: what changes between democrats and republicans
In the United States, the political scene is dominated by two main parties:
- The Democratic Party, traditionally associated with the blue color,
- The Republican Party, represented by the red color.
Democrats are generally more favorable to greater public intervention in economics, to redistributive, environmental and social policies. Often identified as progressives, they support the increase in public spending for education, health and welfare (wellness).
Republicans, on the other hand, have more oriented positions for free market, reducing taxes and containing public spending. They are considered conservatives, with greater attention to issues such as security, religion and tradition.
In the USA, the president remains in office for 4 years. It can be re -elected only once, for a maximum of 8 consecutive years. The elections are held in November, but the new president officially enters office on January 20 of the following year, on the occasion of the settlement ceremony (Inauguration Day).
However, from 1945 to today, there have been three important exceptions to this regular scan, caused by extraordinary events:
- Harry S. Truman took over April 12, 1945 to Franklin D. Roosevelt, who died while in charge.
- Lyndon B. Johnson, became president on November 22, 1963, after the assassination of John F. Kennedy.
- Gerald Ford took the presidency on August 9, 1974, following the resignation of Richard Nixon during the Watergate scandal.
In all other cases, the presidents began their mandate regularly on January 20 following the election.
These dates at the beginning of the mandate will be fundamental for the analysis that follows, in order to evaluate the actual performance of the market during an administration.
Dow Jones: Because it is the best index to analyze the impact of US presidencies
To evaluate the impact of US presidencies on the financial markets we have chosen, as mentioned above, to use the Dow Jones Industrial Average ($ delay), often abbreviated to Dow Jones.
The Dow Jones is one of the most historical and representative equity indices in the world. Born in 1896, it takes its name from Charles Dow, one of the fathers of modern financial journalism. The index is made up of 30 large US companies leading in their respective sectors, and represents a sort of thermometer of the American economy.
Even if today the S&P500 is often considered a more complete benchmark (covers 500 companies), and the Nasdaq has become popular because of the Big Tech, the Dow Jones has a key advantage for our purpose: it is the index for which we have longer data, consistent and comparable over time.
Since our analysis starts since 1945, the Dow Jones is a long enough index to cover the entire time span that interests us, without resorting to artificial reconstructions or uncertain quality data.
In addition, the Dow Jones has a strong symbolic value: it is the index that many presidents have mentioned in their speeches, precisely because it immediately reflects the perception that Wall Street has of the American economy.
As the Dow Jones reacted to each US president: the complete historical analysis
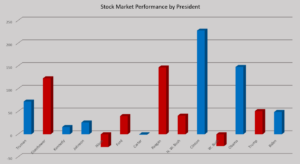
In Figure 1 we reported the overall performance of the Dow Jones Industrial Averal under each president of the United States from 1945 to today. The calculation was carried out from the date of settlement until the actual end of the mandate, including the exceptions already described.
The first thing that is striking by observing the graph is the extreme heterogeneity of the results, or the strong variability between one president and the other: some have guided the country in periods of great growth of the markets, others have found themselves facing very difficult historical phases.
The blue bars represent the democratic presidents, the red ones the republicans. Among the most negative cases, Richard Nixon stand out, with a drop of 28% during his mandate, and George W. Bush, who closes with -26%, penalized by the outbreak of the Dot -Com bubble and by the financial crisis of 2008. It is interesting to note that the only two presidents with clearly negative returns were both republican, a figure that goes into contrast with the widespread idea of a greater affinity between markets and republican party.
Jimmy Carter, Democratic, recorded a practically flat performance, with a modest -1%.
At the opposite extreme we find Bill Clinton, with an incredible +228%: a historical period characterized by strong economic growth, public surplus budgets and technological boom, which made its presidency the best after -war scholarship. Excellent results also for Barack Obama (+148%), protagonist of the post-crisis recovery 2008, and for Ronald Reagan (+147%), who benefited from the end of hyperinflation and financial expansion of the 80s.
Figure 1. Performance of the Dow Jones based on the US President in office.
Alternation between Democrats and Republicans: is there a political cycle in the markets?
Observing Figure 1, in addition to the variability of the individual presidencies, another interesting element emerges: a sort of political cyclicity. In the United States, a president can remain in office for a maximum of eight years, but there is rarely a long hegemony of the same party.
At a glance, it is noted that there have never been a consecutive ten -year periods dominated by a single political force. Democrats and Republicans alternated with a certain regularity, and this alternation has inevitably also influenced the market trend.
This leads us to ask ourselves a new question: if we stopped looking at the individual figures and we focus on the parties, what were the returns of the Dow Jones during the democratic periods compared to the Republican ones? Is it possible to identify a clearer trend by analyzing the data in this way? To respond, in the next paragraph we will aggregate the results based on the political belonging of the presidents, comparing the overall effect of the two economic visions on the financial markets.
The comparison of equity line from 1945 to 2025
In Figure 2, we have reported the cumulative equity line of two hypothetical strategies: one that invests only during democratic presidential mandates and the other that does it exclusively during the Republican ones. The backtest starts from 1945 and extends until January 20, 2025, using a capital of $ 10,000 for each operation.
As you can see clearly, the two equities never overlap: when a strategy is active, the other remains firm. This occurs because of the natural political alternation between the two parties, already highlighted previously.
At a glance, there is a clear difference between the two curves. The strategy that operates during democratic periods reaches a Net profit of about 53,000 dollars. On the contrary, the strategy linked to republican presidents stops around 39,000 dollars overall, with visibly more contained growth. Translated in annualized terms, it is an average annual return of 6.7% for democrats, against 4.9% for Republicans.
This difference, although not enormous, is consistent and regular over time. In particular, it is observed that in recent decades the republican mandates have had a much weaker impact on the markets: the red curve appears almost flat during the 2000s and only slightly positive in the most recent cycle, suggesting that in this historical phase the markets have reacted better for democratic presidencies.
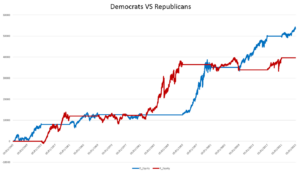
Figure 2. In blue, results under the democratic mandate. In red, under the republican mandate.
Conclusions: does the party in power really affect market trend?
The analysis of historical data from 1945 to 2025 clearly shows that political alternation in the United States had a visible impact on the behavior of the markets, at least on the Dow Jones. Although not the only factor at stake, the political belonging of the president in office seems to influence the performance of the index in a consistent way.
In particular, the equity line built on the basis of democratic and republican mandates reveal a clear superiority in terms of performance for democratic -led periods, with an average annual return of 6.7% against 4.9% of the republican periods.
Of course, the market trends cannot be reduced to a simple party question. Each president had to deal with macroeconomic contexts, global crises and different cycles. However, the data suggest that some political guidelines, such as greater public expenditure, redistributive policies or a more favorable attitude to regulation, may have created more favorable conditions for the market as a whole.
Do you want help to improve your trading approach? Click here >>>
Until next time,
Andrea Unger