

In this article we will analyze, from a quantitative point of view, an indicator that we often hear about and which allows us to measure the strength of the stock market: the Advance-Decline Line.
We will test its effectiveness, comparing any benefits produced by using the indicator compared to a more classic strategy. The objective is to verify whether this tool, often appreciated in theory, can really offer added value in practice.
Do you want help improving your trading approach? Click here >>>
How the Advance-Decline Line indicator works
The Advance-Decline Line is a simple indicator in its construction, but before analyzing its functioning it is important to introduce a fundamental concept: what a stock index is.
A stock index is a group of selected stocks that represent a portion of the market or an entire market. For example, the S&P500 is made up of 500 of the largest American companies, while the Nasdaq focuses primarily on companies in the technology sector. Indices are used to monitor the overall performance of the market or a specific sector.
The Advance-Decline Line can be calculated on different indices. This indicator is intended to measure the overall participation of stocks in market movements, offering a broader perspective than just the performance of the index.
To build it you need two essential pieces of information:
- The number of shares belonging to the index that have risen in a specific period of time (for example, a stock market day).
- The number of stocks belonging to the index that have fallen in the same period of time.
The difference between these two values provides the net figure for the period. This net value is then added cumulatively to those of the previous periods to draw a continuous line, known as the Advance-Decline Line.
Let’s imagine, for example, an index composed of one hundred shares. On a specific day, 70 stocks go up and 30 go down. The difference between the number of rising and falling stocks is +40. This value is added to the Advance-Decline Line value of the previous period. By repeating this calculation for each period, we obtain a line that visually represents the overall participation of the shares in the movement of the index.
Figure 1. The yellow line corresponds to the Advance-Decline Line indicator.
The Advance-Decline Line in theory: an indicator for measuring market strength
The Advance-Decline Line, as it is constructed, is often considered an indicator capable of representing the real strength of the market. Unlike the index price, which can be influenced by a few large stocks, the Advance-Decline Line takes into account the overall participation of stocks in the market movement. In theory, this makes it a more reliable tool for analyzing trends or spotting signs of a possible reversal.
The logic behind it is simple: if a market is rising but the majority of its component stocks are not following the rise, the movement could be unsustainable. Conversely, a market in which the majority of stocks participate in the upside is considered stronger.
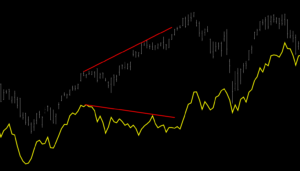
Figure 2. Example of a weak market based on the Advance-Decline Line.
Strategy based on the Advance-Decline Line: application to the SPY ETF
Let’s try to develop a strategy using SPY, the ETF that replicates the performance of the S&P500. The choice of SPY compared, for example, to the index future, is motivated by the fact that the Advance-Decline Line is calculated considering the number of shares that rise and fall during the cash session, i.e. the regular trading hours of the stock markets (9:30 a.m. to 4 p.m. Eastern Time). Since the future trades 23 hours a day, it does not exclusively reflect the performance of stocks during the cash session.
We will therefore use the Advance-Decline Line calculated on the stocks that make up the S&P500 index. Since, as mentioned above, this indicator should represent the real strength of the market, we will use it as a basis for generating entry and exit signals.
The time series chosen for the analysis is composed of daily data, where each bar represents a stock market day. The operational logic is as follows:
- Entry: We will open an upward position if the Advance-Decline Line exceeds the maximum value reached in the last 10 periods (equivalent to two stock market weeks).
- Long Exit: We will close the position if the Advance-Decline Line closes below the low of the last 10 periods.
- Order Execution: Positions will be opened and closed at the opening of the next bar, once the condition is verified.
Additionally, a fixed stop loss of 2% will be applied. Although this value is not optimized, it is intended to eliminate any outliers, i.e. anomalous values. Each operation will be carried out using a fixed capital of 10,000 dollars, purchasing a number of contracts that reflects this value.
Finally, in Figure 3, it is possible to observe a practical example of a trade generated by this strategy.

Figure 3. Example of entry and exit from the position carried out by the strategy based on the Advance-Decline Line indicator.
Results obtained by testing the indicator-based strategy from 2010 to 2024
Looking at the results since 2010, the equity line shows overall constant growth, as can be seen in Figure 4. Although there are several drawdowns, the strategy continues to form new equity peaks.

Figure 4. Equity line of the strategy based on the Advance-Decline Line trading indicator.
In the period analyzed, this strategy generated a net profit of $8,300. The average trade, as can be seen from Figure 5, stands at 63 dollars, equal to just over 0.6% per operation compared to the capital dedicated to each trade.
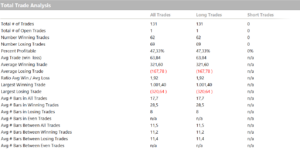
Figure 5. Total Trade Analysis of the strategy based on the Advance-Decline Line indicator.
Indicator effectiveness test: comparison with a price-based strategy
Although the results obtained seem promising, it is important to verify whether the Advance-Decline Line really offers added value compared to a strategy applied directly to the index price. To do this, we will compare the analyzed strategy with a variant based exclusively on the price of SPY, maintaining the same operating rules.
In this version, we will enter a long position when the close price exceeds the high close of the last 10 bars, and we will close the position when the close price falls below the low close of the last 10 bars. Again, all positions will be opened and closed at the opening of the next bar, once the conditions are met.
The other settings will remain unchanged: we will use a stop loss of 2% and we will dedicate a fixed capital of $10,000 to each trade. This comparison will allow us to understand whether the use of the Advance-Decline Line really improves the performance of the strategy or whether the price itself can provide equally valid signals.
Results of the SPY ETF price strategy
Analyzing the results of the new strategy, as shown in figure 6, we can observe a constant growth of the equity line, although there is a more marked drawdown in the 2014-2015 period.

Figure 6. Equity line of the strategy without the indicator.
The net profit reaches a higher value than that of the strategy based on the Advance-Decline Line, reaching $10,500.
From the Total Trade Analysis, shown in Figure 7, an average trade emerges of 89 dollars, with an increase of approximately 50% compared to the 63 dollars of the previous strategy.

Figure 7. Total Trade Analysis of the strategy without the indicator.
Conclusions: Is the Advance-Decline Line a redundant indicator?
The analysis conducted shows that, although the results of the strategy based on the Advance-Decline Line appear promising, those obtained using the price directly proved to be superior, both in terms of net profit and average trade. This raises an important question: Does the Advance-Decline Line really add value as an indicator?
It is certainly possible to vary the periods used to calculate the maximums and minimums, further optimizing both strategies. However, looking at the charts, it is clear that the Advance-Decline Line, in most cases, follows a behavior very similar to the price of the underlying index and this suggests that it may be redundant information, which does not add perspective significantly different from that already provided by the price.
The Advance-Decline Line can certainly be an interesting tool for medium-term evaluations; however, its use in systematic trading strategies does not seem to offer particular advantages.
Do you want help improving your trading approach? Click here >>>
Until next time,
Andrea Unger