
In this article we will develop a Multiday Trend Following Strategy Applied to the Future of Nasdaq (contract exchanged for the CME, with a reference session from 17:00 to 16:00 Hour of Chicago, from Monday to Friday).
The goal is to build a simple but effective system, capable of following the management movements of the market.
To refine the signals we will not limit ourselves to break -in rules: we will introduce a filter based on a specific oscillator, the DVI (David Varadi intermediate oscillator).
Do you want help to improve your trading approach? Click here >>>
What is the DVI, the oscillator that combines magnitude and directionality
To improve the quality of the signals of our strategy, as mentioned above, we introduced the DVI. It is a relatively not very widespread but very interesting indicator, because it combines two fundamental concepts of price analysis:
- the magnitude of movements, i.e. the variation of the price compared to average mobile reference,
- The stretch, that is, the balance between the upper and bearish days observed on different horizons.
Both these components are then normalized through a percent rank (i.e. the relative position of a value compared to the last n data, expressed on a scale from 0 to 1) and combined with different weights (generally 80% magnitude and 20% stretch). The result is an oscillator that moves between 0 and 1, able to grasp the directionality of the market without being excessively noisy.
In operational practice, DVI can be used as a directional filter:
- higher values indicate a consolidated bullish trend,
- lower values instead signal bearish conditions.
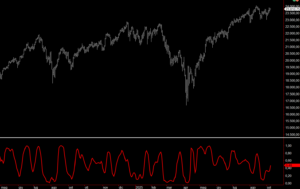
Figure 1 shows an example of application of the DVI on the future of Nasdaq. As you can see, the oscillator manages to follow the market trend with good regularity, returning a more stable picture than traditional indicators such as RSI or Stocastic.
Figure 1
Base strategy: Multiday Breakout on Nasdaq Future
As anticipated, the basic logic is that of a Multiday trend following strategy. The term trend following means an approach in which we try to follow the dominant direction of the market: if the price breaks key levels upwards, an upward continuation is expected, while if you violate levels downwards, we are preparing to ride a possible descending phase.
In our case, the key levels are represented by the maximum and minimum of the previous session (the one that, we remember, ranges from 17:00 to 16:00 Hour of Chicago).
- If the price exceeds the maximum of the past session, we open a long position, assuming that the market is taking a new bullish leg.
- On the contrary, if the price drops under the minimum of the previous session, we enter short, with the expectation of a bearish continuation.
To make the strategy more robust and prevent individual abnormal events (outliers) from excessively conditioning the results, we have included risk management rules:
- Stop loss fixed 3,000 dollars,
- Fixed take profit of $ 5,000.
The backtest was performed with 1 future contract on the Nasdaq, so as to have a clear measure of the effectiveness of logic without distortions due to excessively positive or negative trade.
Backtest: strengths and weaknesses of the base strategy
The backtest starts from 1 January 2010 and the results obtained with the basic Breakout strategy are not particularly exciting.
Figure 2 shows the equity line of the strategy: there is an initial long period of difficulty, with a bearish phase that lasts several years, followed by a more recent recovery but still characterized by strong volatility. Overall, the trend does not appear linear or constant, a sign that the pure logic of breakouts on the maximum and minimum of the previous session is not sufficient to generate stable profits.
A more detailed analysis through the Total Trade Analysis (Figure 3) confirms this impression, but above all highlights the real weak point: the short side.
- The Long Trade show a successful percentage of 39.79% with a positive Averal Trade ($ 127.76).
- The short trade, on the contrary, have a winning percentage of just 29.29% and a negative Averal Trade (–110.68 $).
This result is not surprising: in the last fifteen years Nasdaq has shown a strong long -term upward tendency. In this context, trying to ride the bearish movements with a logical breakout has produced more false signals than real opportunities, while the long operations benefited from the structural thrust of the market.
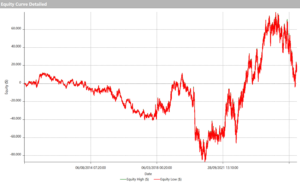
Figure 2
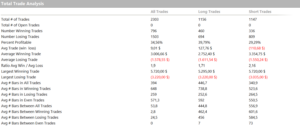
Figure 3. Total trade analysis of the base strategy without filters or improvements.
Time Window: when it is better to operate to increase efficiency
An important aspect in the construction of a Multiday strategy is the choice of Time Window, that is, the time interval in which we allow the system to open new positions. In other words, not all hours of the trading session are considered equal: some time slots are more chaotic or less reliable, and limiting us to the “cleaner” ones can significantly improve the results.
Figures 4 and 5 shows the results of the optimization, analyzing several start and end times of the Time Window.
Looking at the tests on the start time, it is noted that the performances improve significantly by moving the time window time from the early hours of the session to 10:00. It makes sense: in this way the false signals generated in the phase immediately following the opening of the Equipment (8:30 hours of Chicago) are avoided, when volatility tends to be higher and more disordered. At 10:00, however, the market tends to have already absorbed the first wave of orders and shows clearer and coherent movements.
As for the end time, prolong the operation until almost the closure of the session brings good results. A balanced choice is to fix the term at 15:00, so as to capture any trends developed during the day and at the same time avoid operating close to the closure.
Figure 4. Optimization of the start time of the operating window (Time Window).
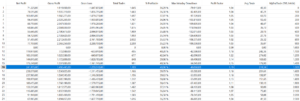
Figure 5
Improvement of results after the optimization of Time Window
The application of optimized time window and the defined rules has produced a marked improvement in performance.
In figure 6 we see the equity line of the Long Trade: the trend is very positive, with an almost constant growth over time. The system manages to exploit the upward breakouts well, which prove to be consistent with the structurally bullish nature of the Nasdaq.
The picture changes by observing the results on the short side (Figure 7): the equity line still appears fragile, fluctuating, unable to generate consistent profits as on the long. However, compared to the initial results, there is a certain improvement, a sign that the combination of basic rules and optimization of the Time Window has made the bearish operations that are a little more manageable, while remaining the Achilles heel of the strategy.
The Total Trade Analysis (Figure 8) highlights some interesting aspects:
- The percentage of overall winning operations climbed to 40.98%, with a Averrage trade of over 200 dollars.
- The trade are well balanced between Long side (549) and short side (554). However, this numerical balance does not reflect the reality of the market, which historically moves more often up. In fact, if the Long side is very profitable (Averal Trade of $ 426), the short side remains marginal, with a Averrage trade of just $ 14.
In summary, the results show that the strategy works very well on the long side and that the shorts, despite having accomplished progress, continues to represent the weakest part.
This leaves room for the introduction of an operating filter: an instrument capable of better selecting signals and avoiding low probability operations, especially on the bearish side.
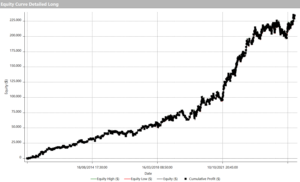
Figure 6. Equity Line of the Long Trade of the strategy with optimized time window time.
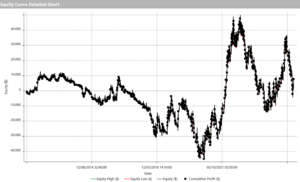
Figure 7
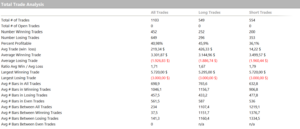
Figure 8. Total trade analysis of the strategy with optimized time window time
Use of the DVI filter to improve the short side of the strategy on the Nasdaq
To improve the quality of the bearish operations, we introduced a filter based on the DVI oscillator, used with a period of 100 in calculating the percent rank.
The idea is simple:
- If the DVI is greater than 0.5 (the average value of the oscillator scale), then we allow the opening of short positions. In this condition, the market is located in a phase of strength, almost hyper -computer: therefore we hypothesize that there is greater probability of witnessing a reversal; In this case, the breaking of the minimum of the previous session becomes a sensible operational signal.
- If the DVI is less than 0.5, on the other hand, we do not open short positions. In this scenario, at the breaking of the minimum of the previous session we simply close any existing long positions, without opening new shorts.
In this way the bearish side is not completely eliminated, but “filtered”: we only operate when the market conditions suggest an excess of bullish force that could prelude to a correction. In other cases, we prefer to stay out rather than force statistically less favorable operations.
Final performance: more balanced and profitable strategy
The introduction of the DVI filter on the short side led to an evident improvement of the strategy, making the overall profile much more balanced.
Figure 9 shows the final equity line: the growth is regular, with an almost continuous progression, and an overall gain that far exceeds the previous versions. The trend shows that the filter has actually reduced false bearish signs, allowing the system to focus only on the moments when the probability of the Storno was higher.
Looking at the Total Trade Analysis (Figure 10), the numbers confirm the goodness of the approach:
- The percentage of winning operations rises to 42.64%, with a Averal trade of over $ 330.
- The Long side naturally remains the strength (Averrage trade of $ 426), but the real news is represented on the short side.
- With the DVI filter, in fact, the shorts also become profitable (Averrage trade of $ 169).
In other words, if previously the revealed sales represented the weak point of the strategy, now the picture is very different: the short side not only no longer penalizes the system, but contributes positively to the final result.
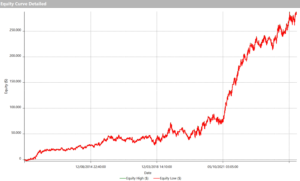
Figure 9. Equity Line of the Breakout strategy on the Nasdaq with DVI filter.
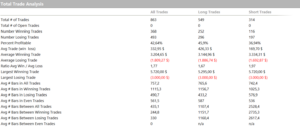
Figure 10. Total trade analysis of the breakout strategy on the Nasdaq with DVI filter.
Conclusions on the use of DVI as a filter in breakout strategies
The introduction of the DVI filter represented an important step in the evolution of the strategy. After an initial phase characterized by swinging results, especially on the short side, the filter has made it possible to improve the selection of signals, restoring a more regular eagle and a decidedly more balanced risk/performance profile.
Of course, the work does not stop there. There is still ample room for improvement:
- The threshold of the DVI could be optimized (instead of the fixed value of 0.5),
- test different combinations of stop loss and take profit,
- Or integrate other filters to further reduce false signals.
Ultimately, this study highlights how a simple logic, if refined with targeted tools, can turn into a solid base on which to build robust and potentially profitable strategies.
Do you want help to improve your trading approach? Click here >>>
Until next time,
Andrea Unger