
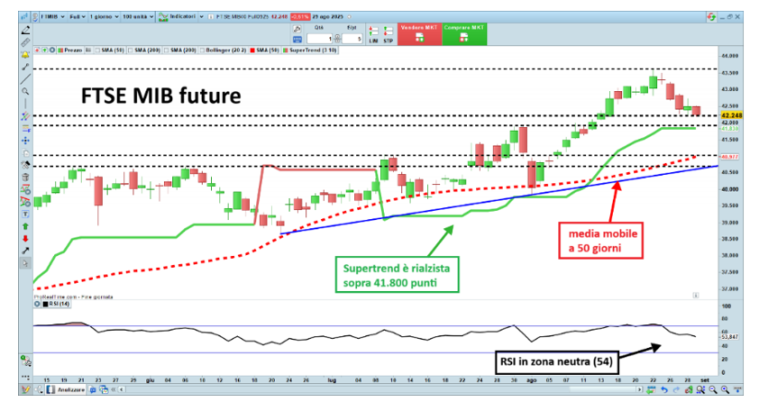
FTSE MIB Future – After reaching a top of 43,600 points on August 22, a corrective phase started. From the graph you can see the following things:
- The SuperTrend indicator indicates rise above 41,830 points and there is also the static support of the maximum of late July.
- The 50 -day mobile average (red) transits 40,980 points.
- The RSI oscillator is at 54 which is a neutral area.
- The technical levels are:
- Resistance = 43,600 – 44,250 points;
- Supports = 41,950 – 41,000 points.
- To have a real bearish reversal of the trend, it would be necessary to go down below 38,700 points but this hypothesis is currently unlikely.
- In addition to the graphic situation we also consider the situation of the fundamentals for which we go to see the Target Price table of the titles of the Paniere del Ftse Mib which can be found at the following link: https://www.finanzaonline.com/rubriche/ftse-mib-tutte-raccomandazioni-bu-e-dagli- analyzes-40-Titoli-27-08-2025. From this table it is seen that the prices of the titles of the FTSE MIB are all very close to their target price. So our market, at least as far as the Large Caps is concerned, has no underestimation but is not yet on the bubble.
- And then we also take a look at the table of the dividend yield of the individual baskets of the basket: https://www.finanzaonline.com/rubriche/dividiand-yield-la-dla-ftse-mib-rende-piu-chi-men-08-25 it is seen that in the years the dividends therefore increase in the long period there We have to wait for a price climb (Long -term bullish View). This increase also takes place thanks to the buy back processes that many companies do.
Conclusions – In the last week the FTSE MIB has started a corrective phase that has the beneficial effect of downloading the excesses of hyper -computer on the market. In my humble opinion we are faced with a phase of consolidation of prices, on whose duration I do not express myself, but which should be preparatory for further future risers that will be a continuation of the long -term trend which is always bullish. However, given the high prices achieved, it is to be conceivable that the remaining climbs of ascent are quite limited.
Not likely a bearish reversal of the long -term trend that would only be happened in the event of a passage under 38,700 points.
Subscribe to the Lombardreport.com Readers Conference.com
And now let’s analyze two alternative investments. The first is gold and precious metals.

The Gold For a few months in a lateral phase but if you look good between the green straight line and the Red you can glimpse a bullish triangle, which will be completed above the red fee that is at $ 3,535. This storage pattern is now in the terminal phase and in theory the completion of this pattern launches the price towards area $ 3,850 – $ 3,900.
And on the other hand also Bank of America sees the price of gold at $ 4,000 as shown in the following link:
https://www.kitco.com/News/article/2025-08-28/gold-remains-4000-us-doller-weakens-bank- America
Well (indeed better) the Silver which last night passed $ 40. But let’s realize that historically the average price ratio Gold / Silver lies around 70. So in theory with the Gold at $ 3,500, the silver should price $ 3,500 / 70 = $ 50. In other words, silver is underestimated with respect to gold.
Very nice graphically also the Platinum, also in the storage phase.
It must be said that the ascent of precious metals prices is favored by the cutting of the Fed rates and the consequent weakening of the dollar.
Subscribe to the Lombardreport.com Readers Conference.com
The second alternative investment to be attentive concerns the following title of the Chinese stock exchange.

Alibaba Friday from a beautiful bullish signal according to the Candlestick. In fact it forms a nice gap up with explosive volumes and the candle is green and long. So investors bought strongly. The news that made the title fly is as follows:
https://www.ilsoftware.it/alibaba-prepara-un-nuovo-chp-a-cina-celera-per-colmare-gap-con-nvidia/
But I also really like Baidu who is now forming a round Bottom. What if China’s turn was now?
Article by Massimo Melosi
Disclaimer: Specifies that:
- The indications provided are personal simulations and are not a solicitation for their use by others. Everyone must decide the investments of their own heads. Therefore any responsibility for their improper use is declined.
- The author of this article is an investor and could hold the titles subject to his analyzes.